US Dollar (DXY) Index Highlights
- US job market strong in April, exceeding expectations
- USD weak against majors, but strong against JPY.
- Market’s direction uncertain until there is more clarity from US data
US Dollar (DXY) Index Overview
On Friday, the US Dollar initially gained ground against major currencies but eventually weakened against a basket of major currencies. It remained stronger against the Japanese Yen, but the Euro, British Pound, and Canadian Dollar made gains against the greenback. The Invesco DB US Dollar Index Bullish Fund ETF (UUP) finished lower at $27.67, down $0.03 or -0.13%. The June US Dollar Index futures settled lower at $101.035, down $0.149 or -0.15%.
US Job Market Beats Expectations
The US job market had a strong performance in April, with employers adding more jobs than expected and wages increasing solidly. Nonfarm payrolls increased by 253,000 jobs last month, exceeding economists’ expectations, and the unemployment rate dropped to a 53-year low of 3.4%. This signals a healthy labor market that may prompt the Federal Reserve to keep interest rates higher to combat inflation.
Trading Derivatives carries a high level of risk to your capital and you should only trade with money you can afford to lose. Trading Derivatives may not be suitable for all investors, so please ensure that you fully understand the risks involved, and seek independent advice if necessary. A Product Disclosure Statement (PDS) can be obtained either from this website or on request from our offices and should be considered before entering into a transaction with us. Raw Spread accounts offer spreads from 0.0 pips with a commission charge of USD $3.50 per 100k traded. Standard account offer spreads from 1 pips with no additional commission charges. Spreads on CFD indices start at 0.4 points. The information on this site is not directed at residents in any country or jurisdiction where such distribution or use would be contrary to local law or regulation.
US Job Growth in February and March Revised Downward
However, previous job data for February and March were revised downward, indicating a slight slowdown in job growth. Job creation for February and March was 149,000 fewer than previously reported. Despite this, job growth has averaged 290,000 jobs per month over the prior six months. The market’s direction is difficult to gauge until there is more clarity from US data.
US Dollar Falls Amid Policy Shift
The initial move up in the greenback was likely in part due to investors who were short the currency, or betting it would fall, covering their positions. The dollar has fallen from a 20-year high last September as investors adjust for the likelihood that the Federal Reserve is at or near the end of its tightening cycle, while peers including the European Central Bank have gotten more hawkish.
Forex Traders Cautious as Fed Considers Rate Cuts
Forex traders are closely watching the possibility of the Fed cutting interest rates in the second half of this year, which investors are pricing in. Although the US economy is showing some signs of slowing down, there are still areas of strength that are making traders hesitant to be too bearish on the US Dollar at this time. The market’s direction is difficult to gauge until there is more clarity from US data.
Analysts Predict Weaker Dollar Due to Dovish Fed
However, many analysts predict that weaker US data and a more dovish Fed will ultimately lead to a weaker US Dollar. Fed funds futures traders are already pricing in around 75 basis points of cuts by year-end, indicating a possible interest rate cut by the Fed in the second half of the year. During the Fed’s meeting on Wednesday, interest rates were raised by 25 basis points to 5% to 5.25%, but the central bank dropped its policy statement language, which stated that it “anticipates” further rate increases would be needed.
Technical Analysis
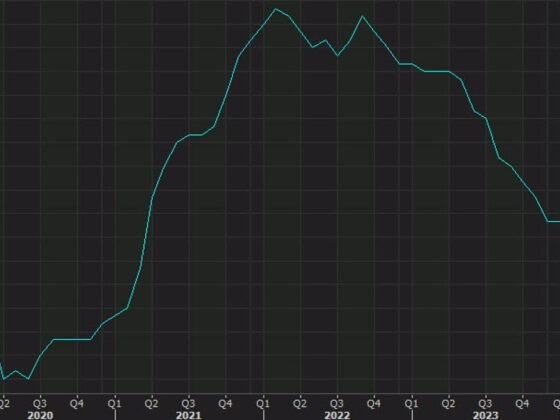
Daily June US Dollar Index
The main trend is down. It turned down last week when sellers took out $100.740. Trader reaction to 101.353 will set the tone early Monday.
A sustained trade over (R1) at 101.353 will indicate the buying pressure is getting stronger with $101.797 (R2) and $102.185 (R3) the next targets.
A sustained move under (R1) at 101.353 will signal the presence of sellers. If this creates enough downside momentum, we could see an acceleration into the support cluster at 100.520 – 100.345.