The USD/CAD pair is currently hovering around the 1.3543 level, experiencing slight declines following earlier highs near 1.3560. The market is digesting the latest Personal Consumption Expenditures (PCE) data from the US, with investors eagerly awaiting upcoming employment-related figures that could offer insights into the Federal Reserve’s future policy decisions.
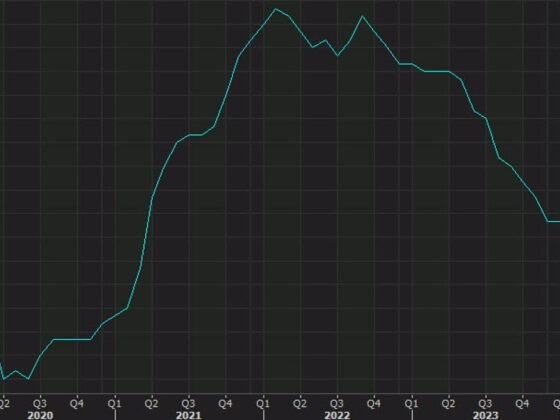
February’s PCE figures, a crucial metric for assessing inflation in the US, largely met expectations. The annual PCE Price Index ticked up to 2.5% from January’s 2.4%, which aligns with forecasts. However, the monthly increase of 0.3% fell slightly below the projected 0.4%. Similarly, core PCE, which excludes volatile food and energy prices, rose by 2.8% annually, matching predictions, with a 0.3% monthly uptick. The upward revision of January’s core PCE figures indicates a sustained inflationary trend, potentially influencing the Federal Reserve’s stance on interest rates.
Future Fed policy decisions will be heavily influenced by incoming economic data, particularly indicators of labour market health. Strong employment figures could prompt policymakers to postpone rate cuts beyond June and potentially revise downward the number of expected cuts for 2024, currently set at three. This scenario could strengthen the US Dollar. However, the baseline expectation remains three rate cuts in 2024, starting in June.
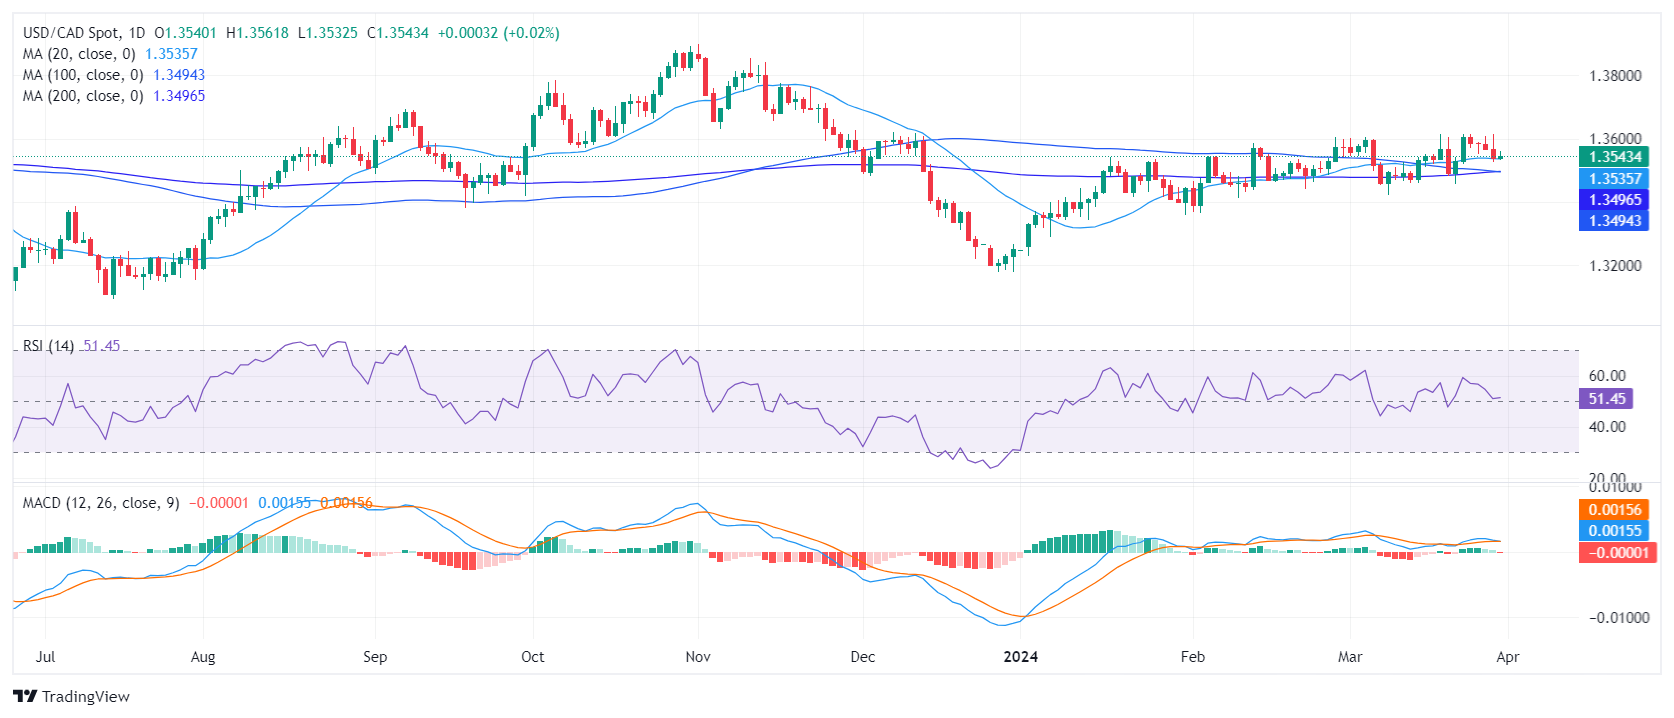
Technical analysis of the USD/CAD pair reveals a relatively stable trend on the daily chart. The Relative Strength Index (RSI) suggests a slight dominance of buying pressure, while the Moving Average Convergence Divergence (MACD) histogram shows a new red bar, indicating weak bullish momentum.
Examining the Simple Moving Average (SMA), the pair remains above the 20, 100, and 200-day SMAs, suggesting a bullish trend. However, the 20-day SMA around the 1.3530 area is currently being tested, and maintaining this level will be crucial for continuing bullish sentiment.
USD/CAD daily chart
USD/CAD
| OVERVIEW | |
|---|---|
| Today last price | 1.3541 |
| Today Daily Change | 0.0001 |
| Today Daily Change % | 0.01 |
| Today daily open | 1.354 |
| TRENDS | |
|---|---|
| Daily SMA20 | 1.3536 |
| Daily SMA50 | 1.3505 |
| Daily SMA100 | 1.3497 |
| Daily SMA200 | 1.3495 |
| LEVELS | |
|---|---|
| Previous Daily High | 1.3614 |
| Previous Daily Low | 1.3525 |
| Previous Weekly High | 1.3614 |
| Previous Weekly Low | 1.3456 |
| Previous Monthly High | 1.3606 |
| Previous Monthly Low | 1.3366 |
| Daily Fibonacci 38.2% | 1.3559 |
| Daily Fibonacci 61.8% | 1.358 |
| Daily Pivot Point S1 | 1.3506 |
| Daily Pivot Point S2 | 1.3471 |
| Daily Pivot Point S3 | 1.3417 |
| Daily Pivot Point R1 | 1.3594 |
| Daily Pivot Point R2 | 1.3649 |
| Daily Pivot Point R3 | 1.3683 |