The difference between success and failure in Forex / CFD trading is highly likely to depend on which assets you choose to trade each week and in which direction, and not on the methods you might use to determine trade entries and exits.
When starting the week, it is a good idea to look at the big picture of what is developing in the market as a whole and how such developments are affected by macro fundamentals, technical factors, and market sentiment.Read on to get my weekly analysis below.Fundamental Analysis & Market Sentiment
I wrote in my previous piece on 1st January that the best trade opportunities for the week were likely to be:
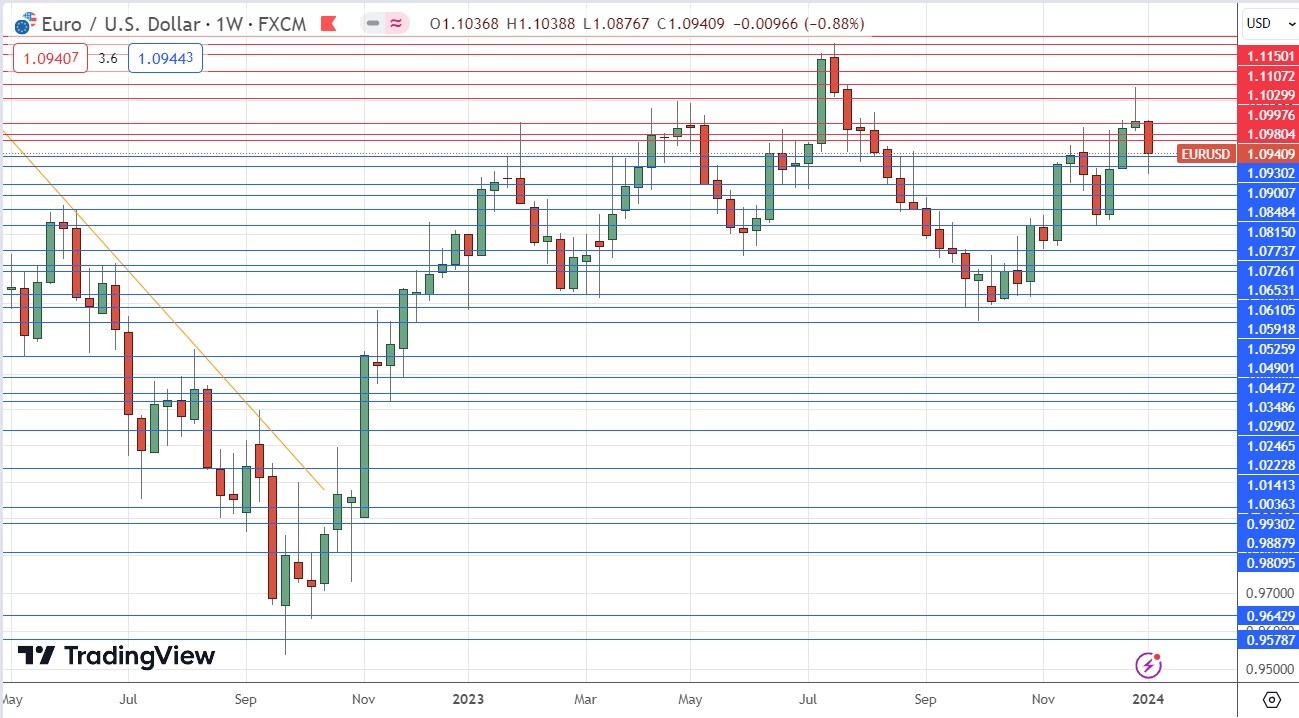
- Long of the EUR/USD currency pair. This fell by 0.88% over the week.
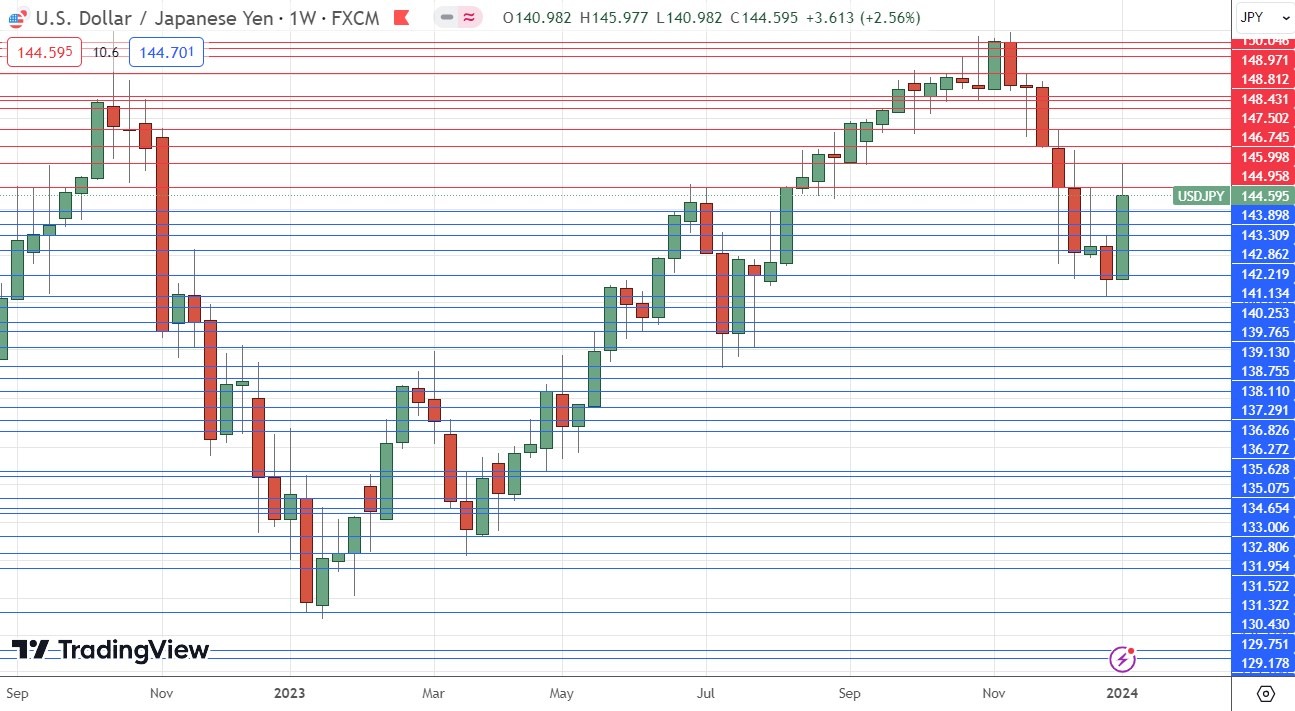
- Short of the USD/JPY currency pair. This rose by 2.56% over the week.
This produced an overall loss of 3.44% which averages to a loss of 1.77% per asset.
Last week was a notable week in the markets as most of the week saw quite a strong reversal of the formerly dominant risk-off trend which had pushed down the US Dollar and boosted stock markets. This seems to have been driven more by the start of a new calendar year, which often produces choppy or reversed markets, rather than any significant data release, although the FOMC Meeting Minutes did include language that it would not rush to cut rates, which may have contributed to this price movement. This powerful counter trend movement saw a reversal at the start of Friday’s New York session, possibly given legs by the stronger than expected US non-farm payrolls and average earnings data (the latter increasing month-on-month by 0.4% compared to the 0.3% which was expected), although these would logically be expected to strengthen rather than weaken the US Dollar.
It may be that we now see December’s risk-on trend resume after Friday produced a fresh move in this direction.
There were a few other important economic data releases last week, mostly in the USA:
- US JOLTS Job Openings – approximately as expected.
- US ISM Services PMI – this was worse than expected.
- US ISM Manufacturing PMI data – approximately as expected.
- US Unemployment Claims – this was slightly better than expected.
- Canadian Unemployment Rate – this was a little better than expected.
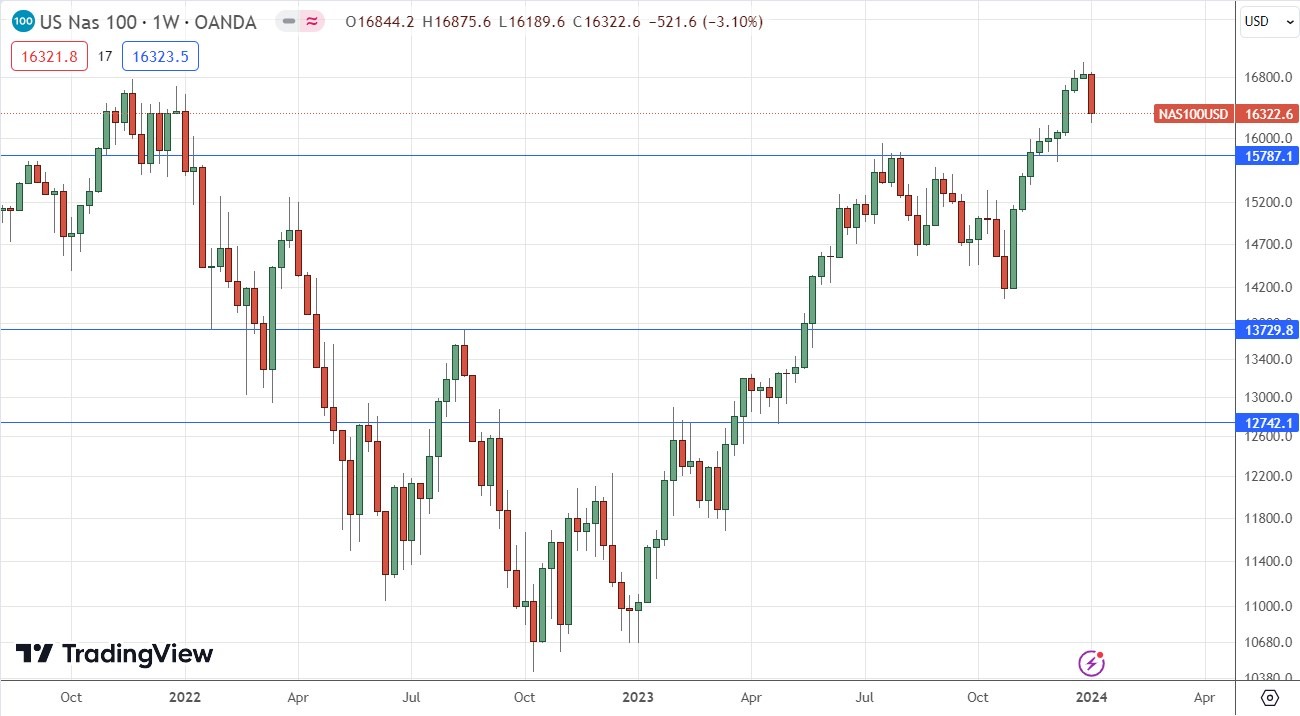
These factors lifted major US stock market indices to a ninth consecutive week of gains, and in the case of the tech-based NASDAQ 100 Index, another all-time high price just shy of 17000.
The Week Ahead: 8th January – 12th January
The coming week in the markets is likely to see an even higher level of volatility, as there will be a release of US inflation data, which is more or less the most closely watched data in the market now, especially concerning Forex. Keep in mind that the start of a new calendar year typically sees volatile, choppy markets, and surprising changes in direction, making price direction difficult to predict at this time of year.
The most important data releases over the coming week will be US CPI (inflation) on Thursday, followed by inflation-adjacent US PPI data on Friday.
Other major economic data releases this week will be:
- Swiss CPI (inflation)
- Australian CPI (inflation)
- Governor of the Bank of England testifies before the UK parliament.
- UK GDP
- US Unemployment Claims
- Chinese CPI (inflation)
Monday will be a public holiday in Japan.
Technical Analysis
US Dollar Index
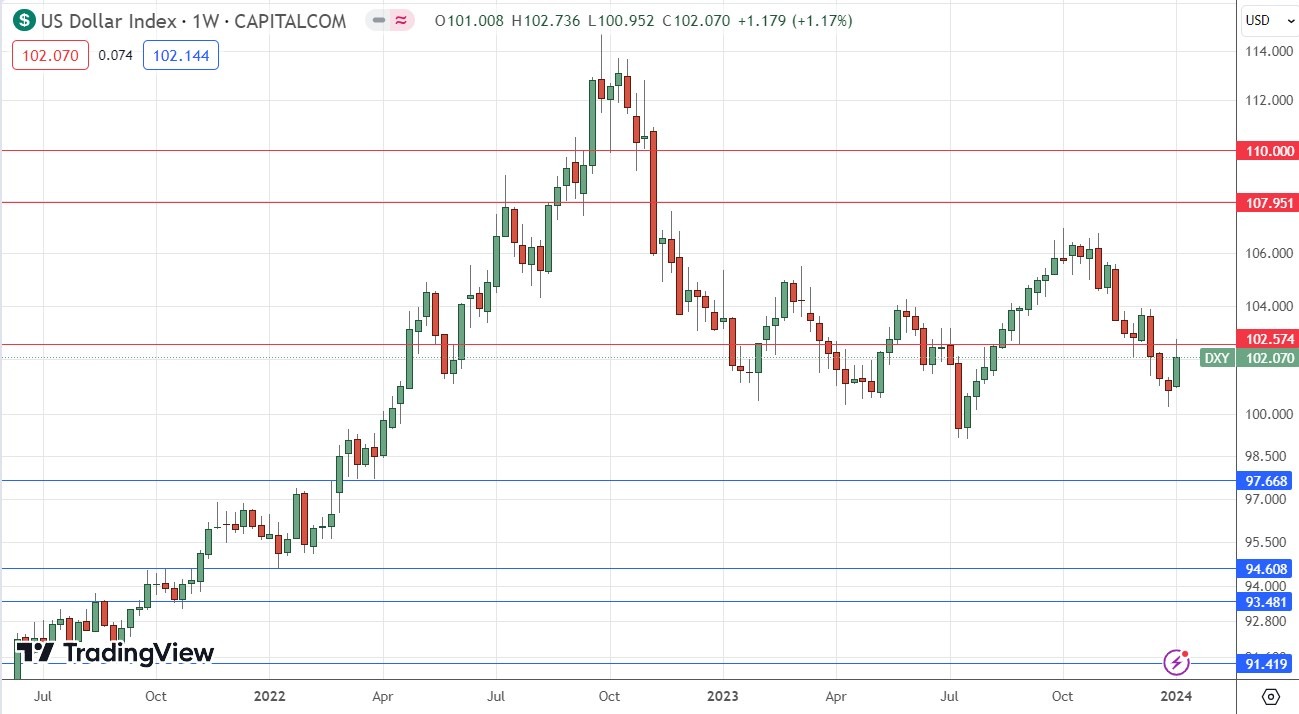
The US Dollar Index printed a bullish candlestick last week, which closed higher. The weekly close was down on the price of 3 months ago but up on the price of 6 months ago, presenting a mixed long-term trend.
Despite the bullish candlestick, it should be noted there are several bearish factors:
- The weekly candlestick has a long upper wick.
- The upper wick of the weekly candlestick looks to have rejected a new key resistance level at 102.57.
- Recent price action has invalidated the former key support level at 101.56.
- The US Dollar gave up some of its gains at the end of last week, suggesting that short-term momentum could be with Dollar bears again.
For these reasons, I am again prepared to be short of the US Dollar again, but as it is still the first half of January, direction in markets can be very hard to predict, so I am cautious.

NASDAQ 100 Index
After rising for nine consecutive weeks to reach a new all-time high, the NASDAQ 100 Index finally printed a bearish weekly candlestick. The decline over last week felt quite strong, but looking at the price chart, we can see that there is nothing out of the ordinary about this drop. It was quite proportionate to other recent weekly falls last October. We have a bull market in US stocks, and the NASDAQ 100 Index has historically been a great investment during bull markets. I think we are seeing a normal bearish retracement, provided that the price does not get established below the support level at 15787.I think it is still wise to look for long trade entries here, ideally on a bullish bounce at or near 15787, or maybe at further technical signs that a short-term bottom has been reached.Long-term conditions remain supportive of the bull market, but the rally became very over-extended after the recent strong rise. EUR/USDAfter printing a candlestick which closed up last week, but which was clearly a bearish pin bar, the price unsurprisingly fell over the past week. However, this was due to broad US Dollar strength and not any real relative weakness in the Euro, so we saw a sizable but still relatively modest decline over the past week.This currency pair likes to trend, and with the bullish long-term trend well established, the price having made a breakout, and short-term moving averages moving above long-term ones, the long-term signs are bullish.This is helped by relative strength in the Euro, which may be getting some traction as the ECB is seen as some way behind the rate cutting curve of the US Federal Reserve, with the ECB not talking about cutting until Q3 2024, while a rate cut by the Fed in March 2024 is widely expected.This currency pair likes to make deep retracements. This, plus the fact that the price has been held up by key support near the round number at $1.0900, is a bullish sign. I see this area as likely to be very pivotal, so I will look to buy at support over the coming week. A further bullish factor is the significant lower wick on last week’s Japanese candlestick.
 USD/JPYThe USD/JPY currency pair made a strong upwards movement last week, after having reached a long-term low price. The move was powerful, and the US Dollar did not advance more strongly against any other currency than the Japanese Yen. Yen weakness was a standout feature of the Forex market, caused by the Bank of Japan’s admission that the effects of the recent tsunami will make it difficult for them to begin moving away from their ultra-loose monetary policy even within the first half of 2024.It is worth noting that the size of last week’s advance was more than 3 times the long-term average true range, which many trend traders would take as evidence that the long-term bearish trend is over.I think that day traders will be wise to look to this pair or other Yen crosses as there is plenty of volatility here, even if direction may not be certain. If the US Dollar falters over the coming week, it could be interesting to trade certain Yen crosses long.


