Manta Network’s price currently holds a favorable position in the upper half of the Bollinger indicator, standing at $3.1428 above the centerline. Despite its overall bullish stance, there are indications of potential changes in the near future due to a declining momentum, hinting at an impending sell signal on the 2-hour timeframe.
The analysis suggests a possible 10% decline in MANTA’s price if the mentioned sell signal materializes. The bearish scenario could be confirmed if the price establishes a higher high above $3.5165. In such a case, the bearish thesis would be invalidated, and Manta Network might experience robust support, potentially limiting any downward movement.
The 2-hour timeframe chart reveals that Manta Network’s price is exhibiting a bullish bias and surpassing expectations above an ascending trendline. It is positioned within the upper range of the Bollinger indicator, with levels at $4.1428 and $3.3544 denoting the upper band and centerline, respectively.
The Relative Strength Index (RSI) outlook suggests a decline in momentum, raising the possibility of a bearish crossover that could lead to a sell signal. If this occurs, MANTA’s price may experience a 10% decline from its current levels. Strong support is anticipated in the convergence of the ascending trendline and horizontal support at $2.8194.
In a more adverse scenario, the price might potentially retreat to the $2.6024 support level, representing a nearly 23% decrease from its current value.
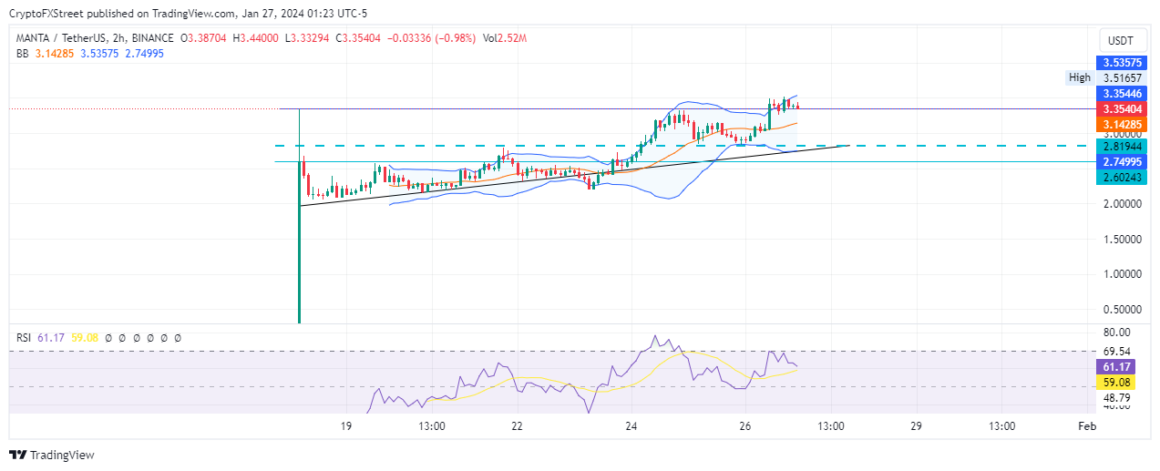
However, considering the RSI at 61, indicating positive price strength with room for further upward movement before reaching the overbought threshold at 70, there is potential for increased buyer momentum. This could propel Manta Network’s price upward, breaking through the upper band of the Bollinger indicator at $3.3544.
To negate the bearish outlook, Manta Network’s price needs to surpass the range high at $3.5165 and establish a higher high above this level.