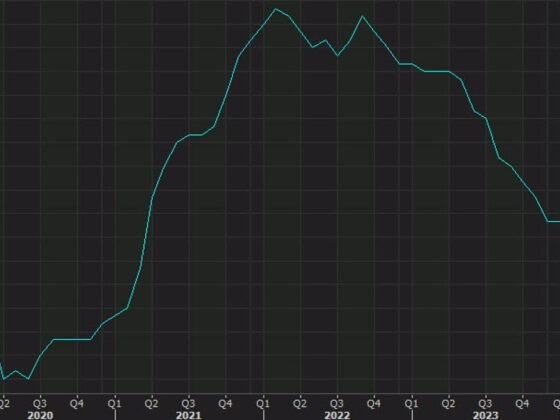
Last week, major US stock indices like the Nasdaq 100 and the S&P 500 continued their upward trajectory, hitting record highs. The S&P 500 particularly surged past the 5,000 mark, fueled by robust economic activity and low inflation. This milestone comes less than three years after the index first reached the 4,000 mark in April 2021, marking a significant 1,000-point gain in a short period.
Focus on the 5,000 Level
While there are signals of potential overextension, such as negative divergence on the Relative Strength Index (RSI) and overbought conditions on the weekly chart, the overall upward trend remains strong. Last week’s price action, which saw a retest of channel resistance as support, underscores the importance of the 5,000 level in the current market environment.
Breakout or Bull Trap?
With the index closing above 5,000 on both weekly and daily charts, breakout buyers may be inclined to enter the market at these levels. However, more cautious investors may wait for a retest of the 5,000 level before making their move. Traders may also monitor lower timeframes for signs of a bullish continuation pattern or trendline breach, which could attract further buying interest and propel the index to new highs. While bull traps are not uncommon around key levels like 5,000, a sustained move above this level is more probable given the overall market sentiment.
Looking Ahead
The upcoming week promises to be eventful for the US equity market, with key economic indicators such as inflation data, retail sales numbers, and consumer sentiment surveys on the agenda. These factors will likely influence market sentiment and shape the direction of the S&P 500 in the days ahead.