The price of silver experiences a sharp rise to $22.70 as the US Dollar shows signs of weakness. This surge comes amidst easing geopolitical tensions, reducing the appeal of safe-haven assets. Investors are closely watching the United States’ core Personal Consumption Expenditure price index (PCE) data for January, expecting insights into the Federal Reserve’s (Fed) rate cut plans. There’s anticipation of a sharp increase in monthly core PCE, potentially impacting the Fed’s stance on interest rates. Kansas City Federal Reserve Bank President Jeffrey Schmid’s remarks on Monday emphasized the need to consider factors like inflation and labor market conditions before rushing into rate cuts.
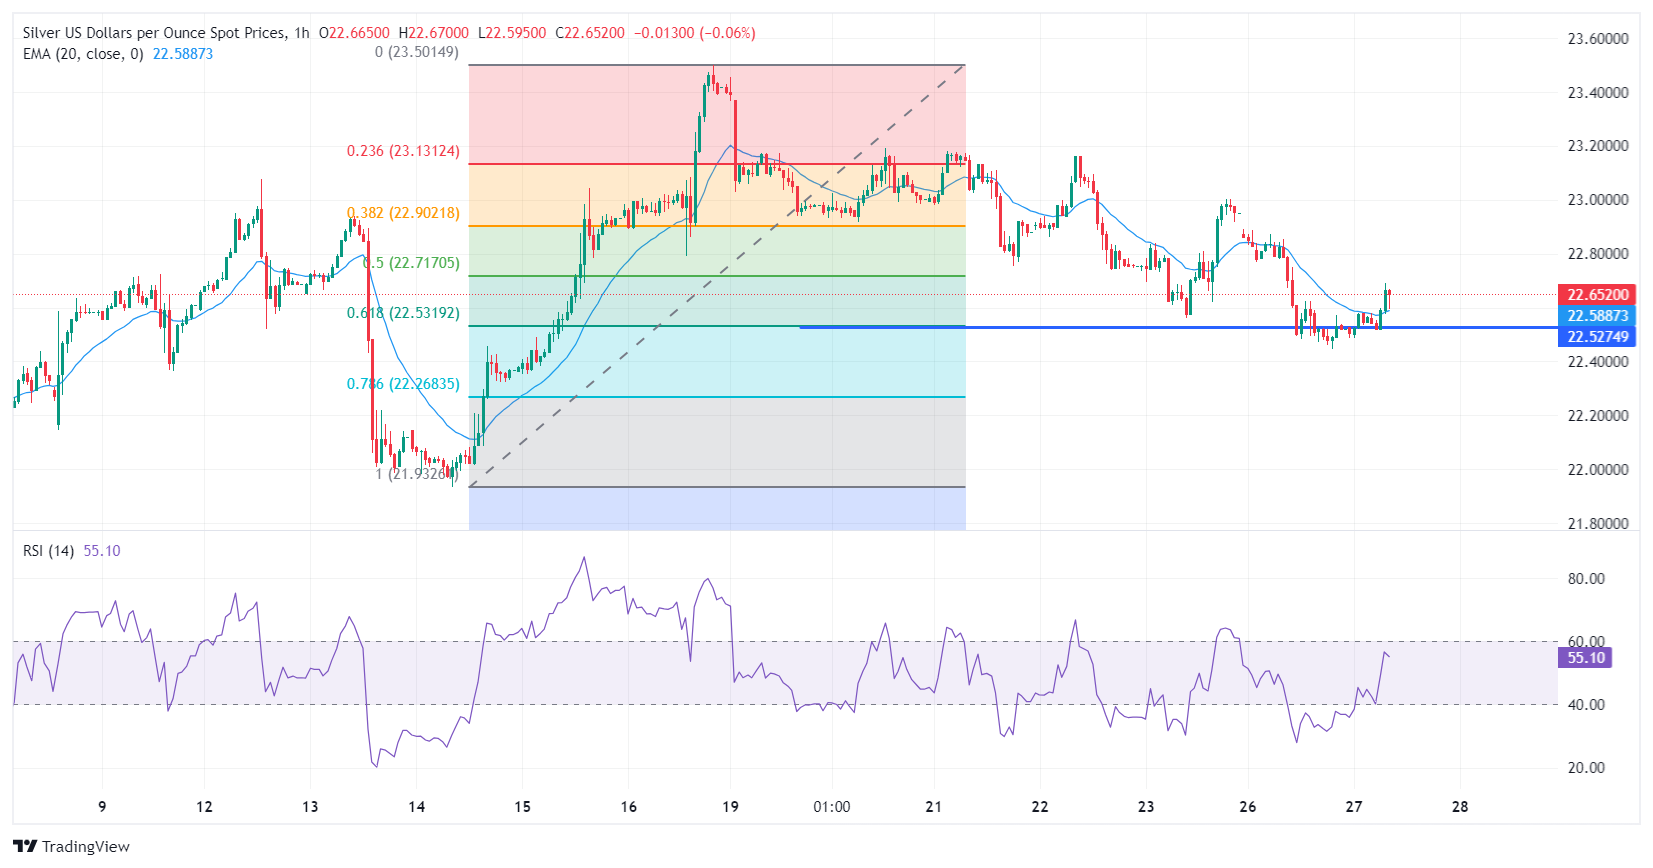
On the technical side, silver finds support near the 61.8% Fibonacci retracement level and surpasses the 20-period Exponential Moving Average (EMA). The Relative Strength Index (RSI) indicates consolidation, suggesting potential stability in the near term. Overall, silver’s price movement reflects the dynamic interplay between geopolitical developments, inflation expectations, and the performance of the US Dollar.
Silver hourly chart

XAG/USD
| OVERVIEW | |
|---|---|
| Today last price | 22.64 |
| Today Daily Change | 0.11 |
| Today Daily Change % | 0.49 |
| Today daily open | 22.53 |
| TRENDS | |
|---|---|
| Daily SMA20 | 22.73 |
| Daily SMA50 | 23.07 |
| Daily SMA100 | 23.21 |
| Daily SMA200 | 23.28 |
| LEVELS | |
|---|---|
| Previous Daily High | 22.95 |
| Previous Daily Low | 22.45 |
| Previous Weekly High | 23.46 |
| Previous Weekly Low | 22.56 |
| Previous Monthly High | 24.09 |
| Previous Monthly Low | 21.93 |
| Daily Fibonacci 38.2% | 22.64 |
| Daily Fibonacci 61.8% | 22.76 |
| Daily Pivot Point S1 | 22.34 |
| Daily Pivot Point S2 | 22.14 |
| Daily Pivot Point S3 | 21.83 |
| Daily Pivot Point R1 | 22.84 |
| Daily Pivot Point R2 | 23.15 |
| Daily Pivot Point R3 | 23.34 |


