Silver prices are hovering around $24.50, awaiting the release of US inflation data. The core CPI is predicted to slow down while headline inflation may hold steady. A breakthrough above $24.60 awaits a fresh catalyst. Silver has been trading in a tight range since Friday and is expected to see movement after the US Consumer Price Index data for February is released at 13:30 GMT.
Analysts forecast a 0.4% increase in monthly headline inflation, up from January’s 0.3%. Core inflation, excluding volatile food and energy prices, is expected to rise by 0.3%, down from 0.4% previously. Annual CPI is expected to remain at 3.1%, while core inflation is projected to decrease to 3.7% from January’s 3.9%.
Market sentiment is bullish ahead of the inflation data release, with S&P 500 futures posting gains and 10-year US Treasury yields dropping to 4.10%. The US Dollar Index is trading within Monday’s range around 102.80.
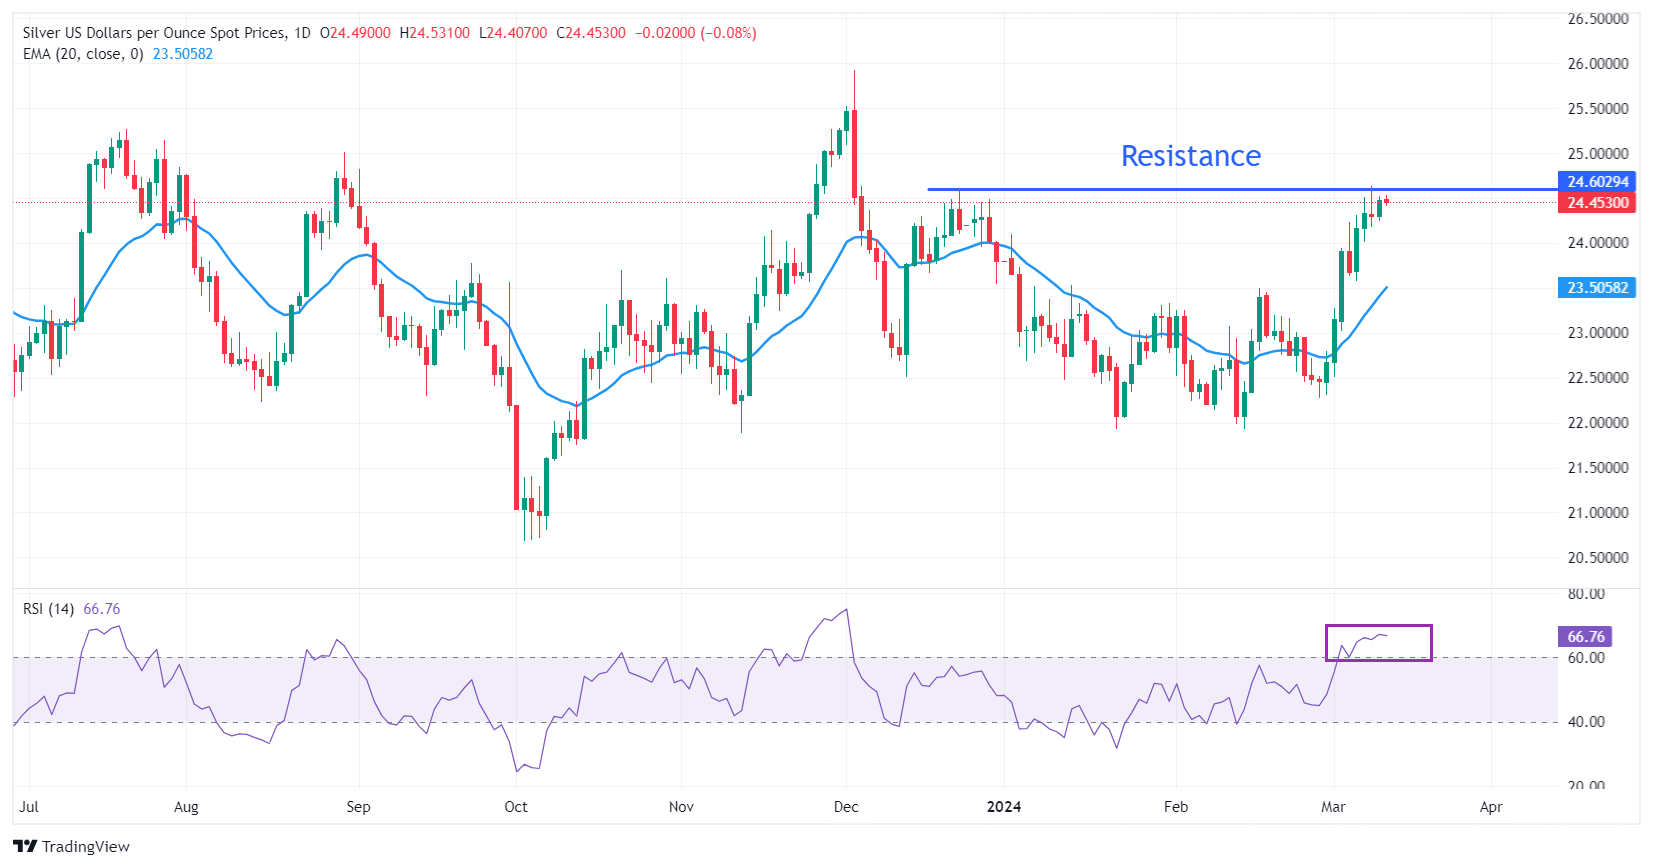
Technically, silver prices have turned sideways after testing resistance at $24.60. The overall trend remains bullish, with a correction expected before further upside. The 20-day Exponential Moving Average near $23.50 suggests strong near-term demand. The Relative Strength Index is in the bullish range of 60.00-80.00, indicating an ongoing bullish momentum.
Silver daily chart
XAG/USD
| OVERVIEW | |
|---|---|
| Today last price | 24.43 |
| Today Daily Change | -0.04 |
| Today Daily Change % | -0.16 |
| Today daily open | 24.47 |
| TRENDS | |
|---|---|
| Daily SMA20 | 23.17 |
| Daily SMA50 | 22.96 |
| Daily SMA100 | 23.3 |
| Daily SMA200 | 23.29 |
| LEVELS | |
|---|---|
| Previous Daily High | 24.52 |
| Previous Daily Low | 24.24 |
| Previous Weekly High | 24.64 |
| Previous Weekly Low | 23.02 |
| Previous Monthly High | 23.5 |
| Previous Monthly Low | 21.93 |
| Daily Fibonacci 38.2% | 24.42 |
| Daily Fibonacci 61.8% | 24.35 |
| Daily Pivot Point S1 | 24.3 |
| Daily Pivot Point S2 | 24.13 |
| Daily Pivot Point S3 | 24.02 |
| Daily Pivot Point R1 | 24.58 |
| Daily Pivot Point R2 | 24.7 |
| Daily Pivot Point R3 | 24.87 |