- USD/CAD has climbed above the 1.3550 mark amid uncertainty surrounding upcoming events.
- The Canadian inflation data for February is expected to be released soon.
- Investors are closely watching the Federal Reserve’s interest rate guidance.
In Tuesday’s European session, the USD/CAD pair surged to 1.3550 after breaking out of a two-day consolidation phase within the range of 1.3510-1.3550. This upward movement in the pair comes amidst uncertainty ahead of significant market events.
Market sentiment seems to be leaning towards risk aversion, as indicated by nominal losses in S&P500 futures during the London session. Additionally, the US Dollar Index (DXY) has reached its weekly high at 103.87, reflecting the prevailing uncertainty before the Federal Reserve’s interest rate decision scheduled for Wednesday. The CME FedWatch tool suggests that the Fed will maintain interest rates within the range of 5.25%-5.50%, with investors closely monitoring any hints about potential rate cuts, which are currently anticipated in the June policy meeting.
Furthermore, the Canadian Dollar’s next move hinges on the release of Canada’s Consumer Price Index (CPI) data for February at 12:30 GMT. Analysts anticipate that the annual headline inflation rate may have increased to 3.1%, up from January’s 2.9%.
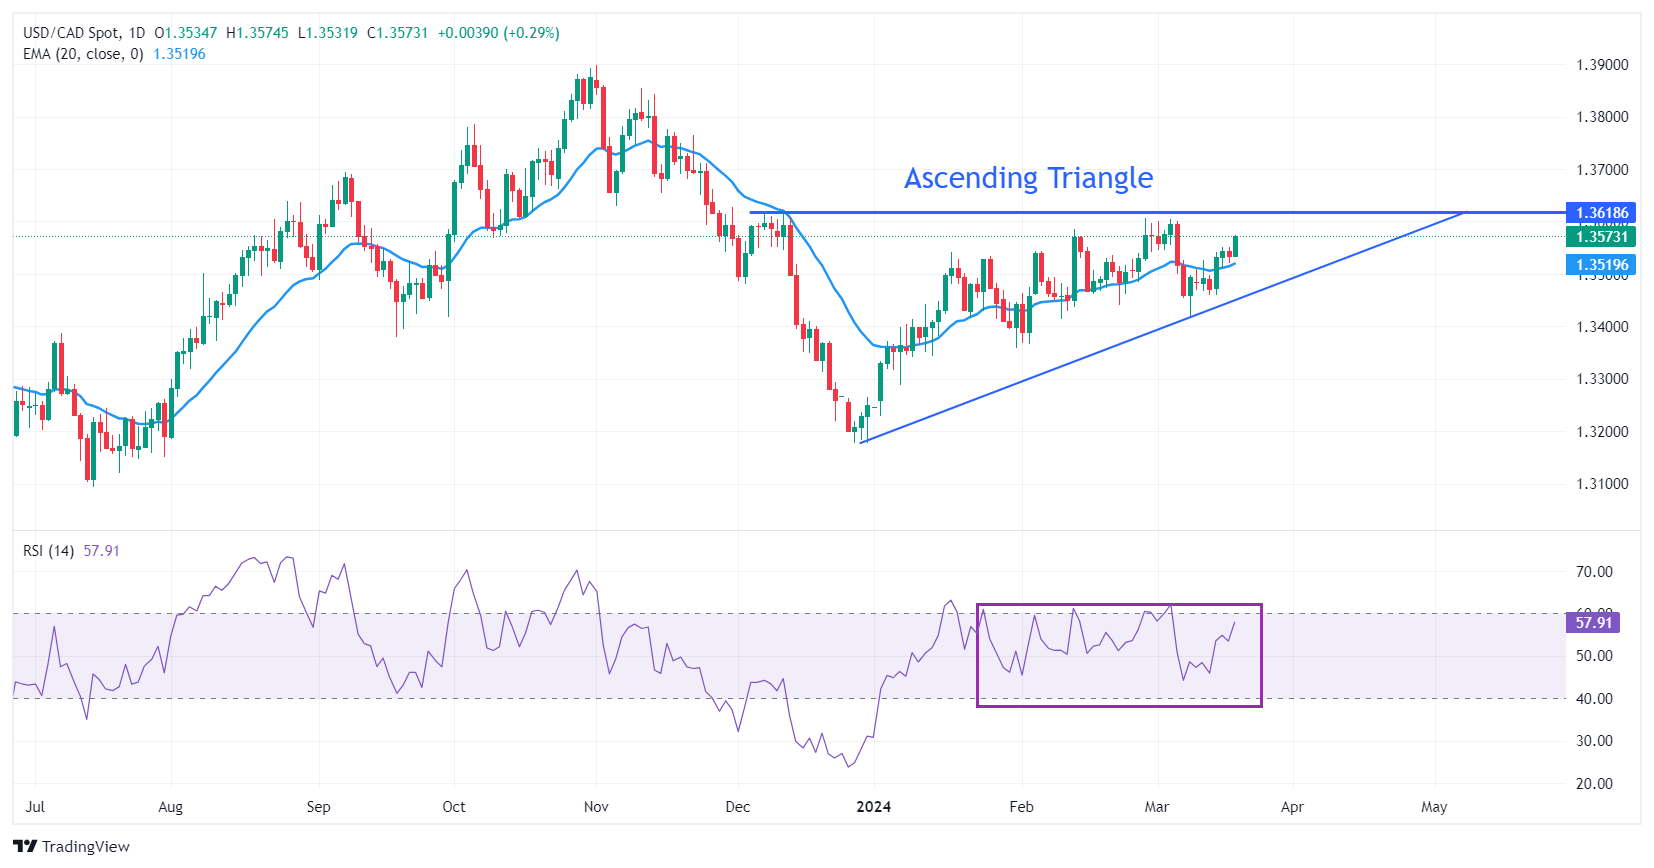
From a technical perspective, the USD/CAD pair is approaching the horizontal resistance level of an Ascending Triangle pattern formed on the daily timeframe since December 7. The near-term outlook appears bullish, supported by the 20-day Exponential Moving Average (EMA) around 1.3520. However, the 14-period Relative Strength Index (RSI) indicates investor indecision, oscillating within the 40.00-60.00 range.
A breakout above the December 7 high at 1.3620 could propel the pair towards the May 26 high at 1.3655, followed by the psychological resistance level of 1.3700. Conversely, a downside move below the February 22 low at 1.3441 could expose the pair to further declines towards the February 9 low at 1.3413 and eventually the January 15 low at 1.3382.
USD/CAD daily chart
USD/CAD
| OVERVIEW | |
|---|---|
| Today last price | 1.3571 |
| Today Daily Change | 0.0037 |
| Today Daily Change % | 0.27 |
| Today daily open | 1.3534 |
| TRENDS | |
|---|---|
| Daily SMA20 | 1.3523 |
| Daily SMA50 | 1.3486 |
| Daily SMA100 | 1.3514 |
| Daily SMA200 | 1.3481 |
| LEVELS | |
|---|---|
| Previous Daily High | 1.3552 |
| Previous Daily Low | 1.3521 |
| Previous Weekly High | 1.3552 |
| Previous Weekly Low | 1.3459 |
| Previous Monthly High | 1.3606 |
| Previous Monthly Low | 1.3366 |
| Daily Fibonacci 38.2% | 1.3533 |
| Daily Fibonacci 61.8% | 1.354 |
| Daily Pivot Point S1 | 1.3519 |
| Daily Pivot Point S2 | 1.3505 |
| Daily Pivot Point S3 | 1.3489 |
| Daily Pivot Point R1 | 1.355 |
| Daily Pivot Point R2 | 1.3566 |
| Daily Pivot Point R3 | 1.3581 |