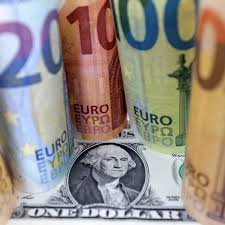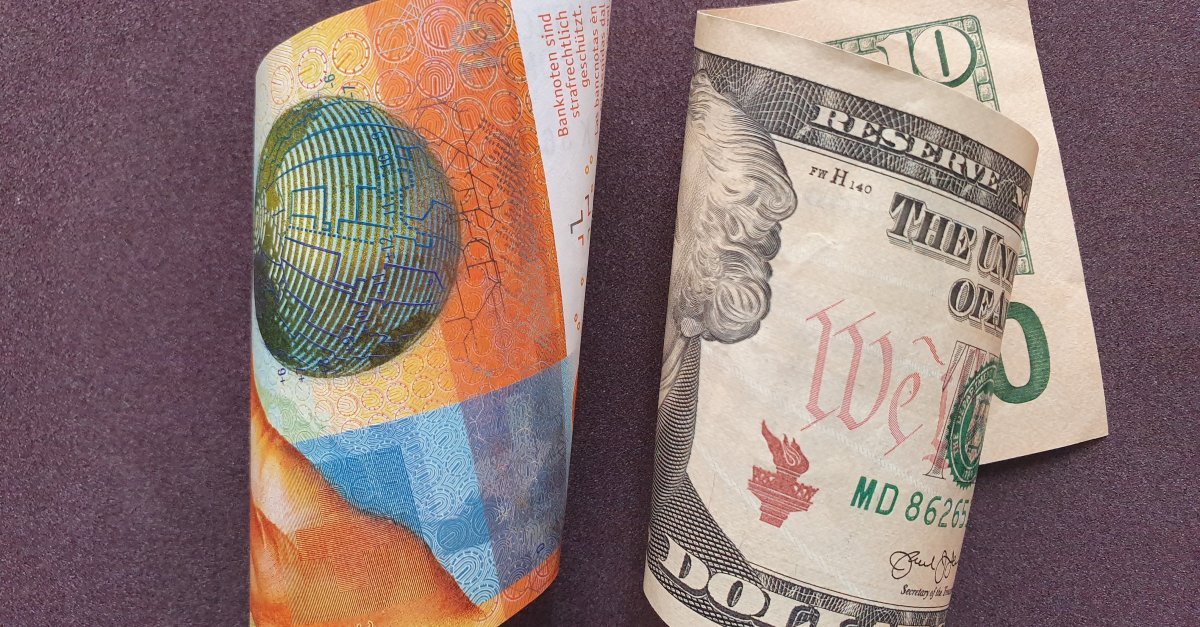
In the European trading session, the USD/CHF pair surpassed the crucial level of 0.9000, supported by a decline in the Swiss Franc following the Swiss National Bank’s surprise decision to cut interest rates. The unexpected move by the SNB, reducing rates by 25 basis points to 1.50%, caught investors off guard as they had anticipated no change in interest rates. This rate cut began the rate-cutting cycle among developed nations’ central banks.
As indicated by decent gains in S&P 500 futures, the market sentiment has improved, reflecting increased risk appetite among investors. Despite the US Dollar easing from its monthly high, the weakening of the Swiss Franc due to the SNB’s decision has bolstered demand for the USD/CHF pair.
Federal Reserve policymakers remain optimistic about easing inflationary pressures despite persistent price pressures in January and February. The US Dollar Index (DXY) has retreated to 104.10, with expectations growing that the Fed will commence interest rate cuts starting from the June policy meeting. 10-year US Treasury yields have also declined to 4.25%, which aligns with these expectations.
While higher house rentals have significantly contributed to US inflation, policymakers express confidence that inflation will gradually return to the target rate of 2%. In an interview with Yahoo Finance, Chicago Federal Reserve Bank President Austan Goolsbee predicted three rate cuts for this year in the March monetary policy meeting.
The market focus will be on releasing the US core Personal Consumption Expenditure price index (PCE) for February on Friday, which will likely guide the next move in the US Dollar.
USD/CHF
| OVERVIEW | |
|---|---|
| Today last price | 0.9016 |
| Today Daily Change | 0.0022 |
| Today Daily Change % | 0.24 |
| Today daily open | 0.8994 |
| TRENDS | |
|---|---|
| Daily SMA20 | 0.8845 |
| Daily SMA50 | 0.8771 |
| Daily SMA100 | 0.8735 |
| Daily SMA200 | 0.8817 |
| LEVELS | |
|---|---|
| Previous Daily High | 0.8996 |
| Previous Daily Low | 0.8969 |
| Previous Weekly High | 0.902 |
| Previous Weekly Low | 0.8822 |
| Previous Monthly High | 0.8886 |
| Previous Monthly Low | 0.8553 |
| Daily Fibonacci 38.2% | 0.8986 |
| Daily Fibonacci 61.8% | 0.8979 |
| Daily Pivot Point S1 | 0.8977 |
| Daily Pivot Point S2 | 0.896 |
| Daily Pivot Point S3 | 0.8951 |
| Daily Pivot Point R1 | 0.9003 |
| Daily Pivot Point R2 | 0.9013 |
| Daily Pivot Point R3 | 0.903 |